Raster data
Fair market value (FMV) rasters
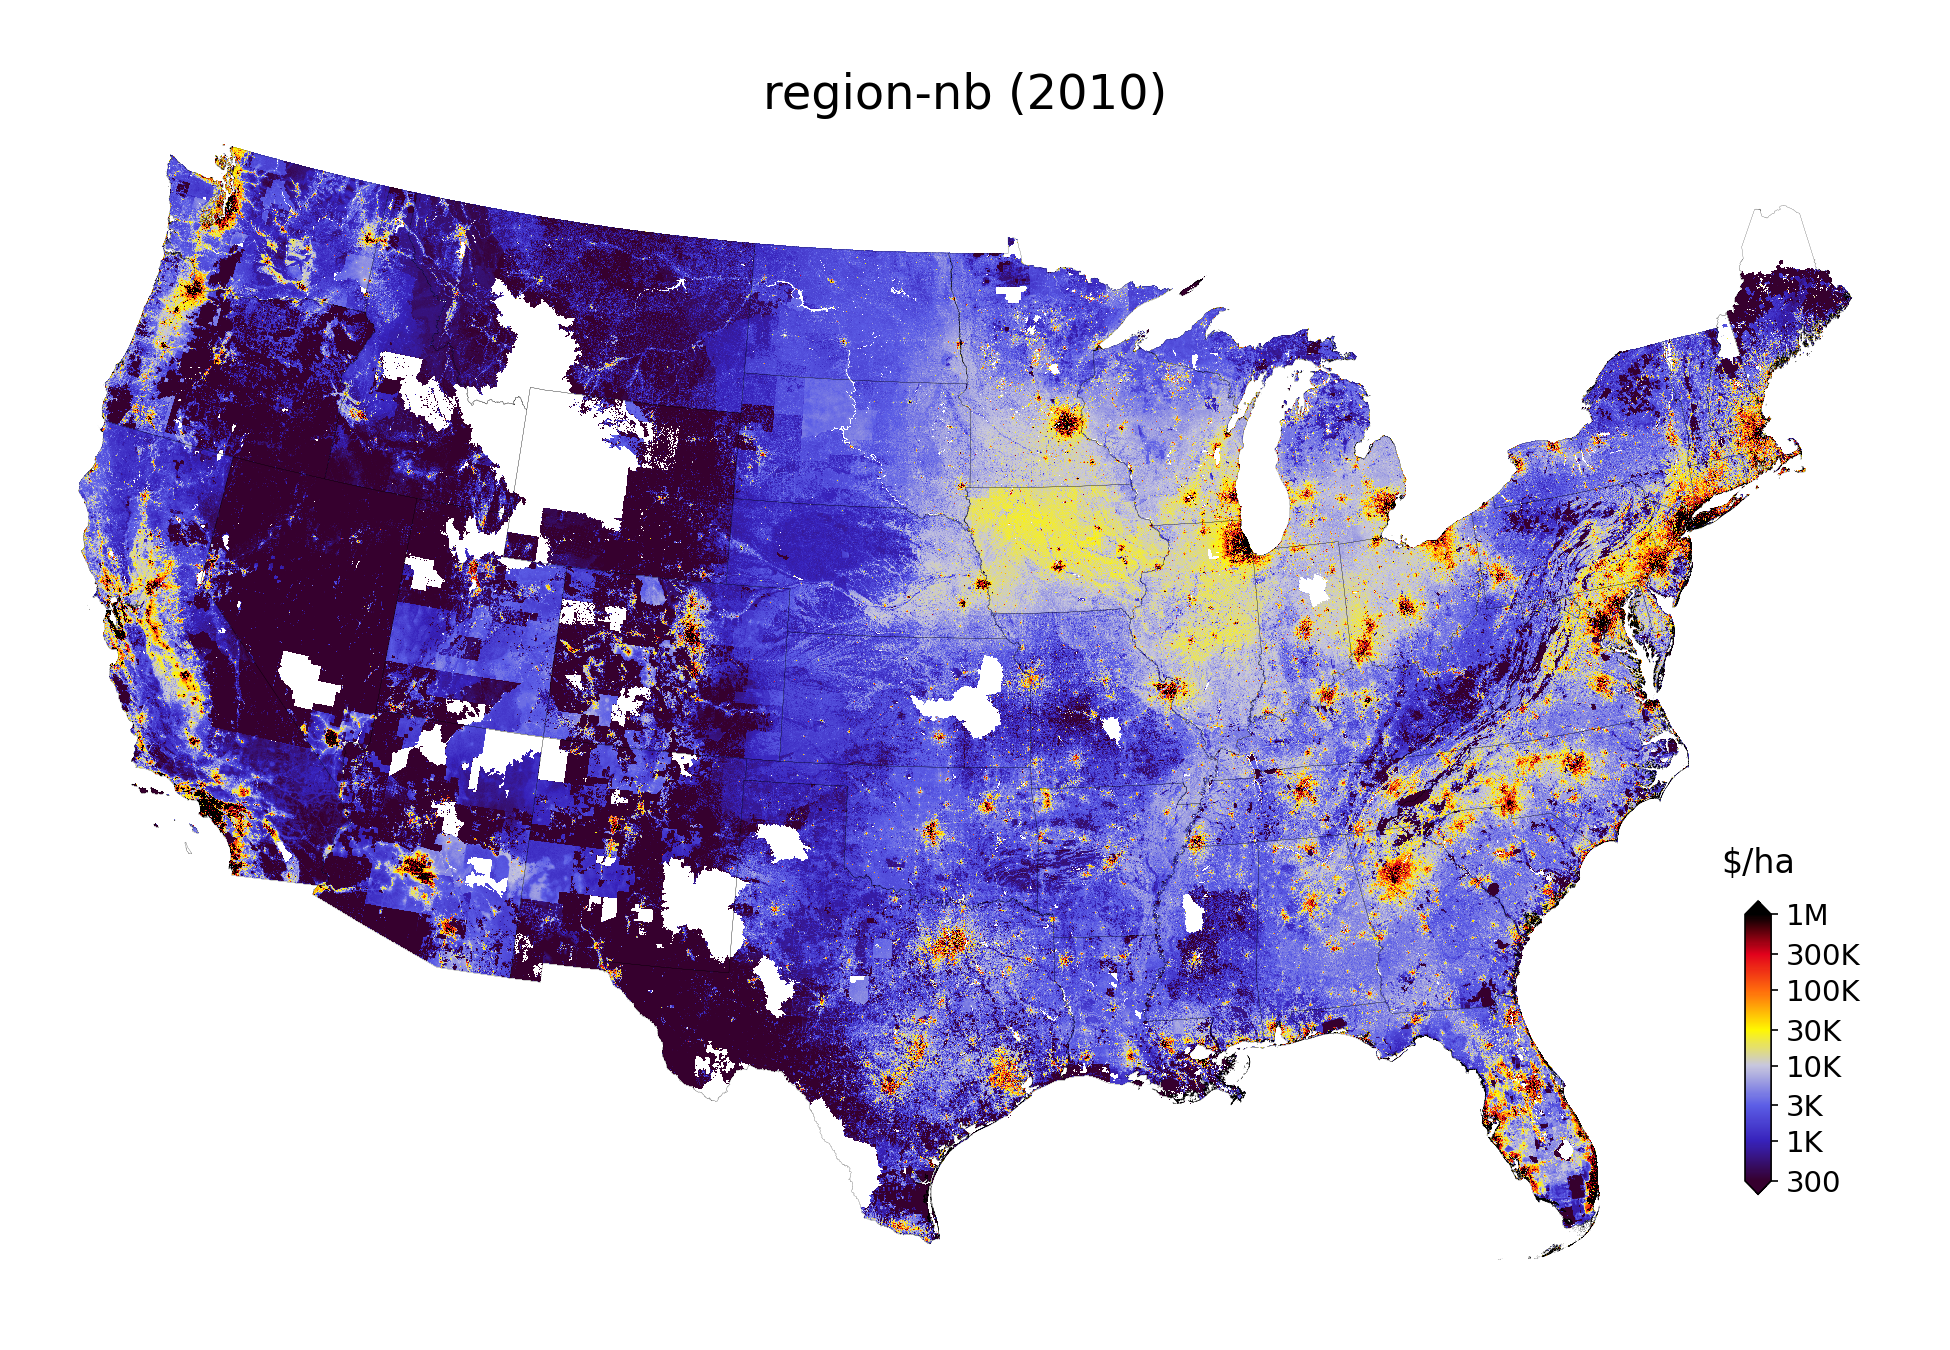
Rasterized parcel-level estimates of fair market value (FMV) for the contiguous U.S.
- Example:
fmv_region-nb_2010.tifis a land value raster with estimates from the modelregion-nb(region & neighbors) for the year2010.
- File location:
rasters/estimates/fmv_<model_id>_<year>.tif, where:model_ididentifies the model, andyearis the year for which the prediction was made.
- Unit:
Natural logarithm of U.S. dollars (real, deflated to Jan 2022), per area (hectare), divided by 16 and converted to
uint8(0-255) to save space.\[\frac{ln(\frac{$}{hectare})}{16}\]- Geoprocessing:
Parcel-level estimates are assigned to their parcel boundary polygons and rasterized.
- Format:
GeoTIFF
- Projection:
Conus Albers (EPSG:5070)
- Resolution:
480 x 480 meters (snapped to the National Land Cover Database)
Area of applicability (AOA) rasters
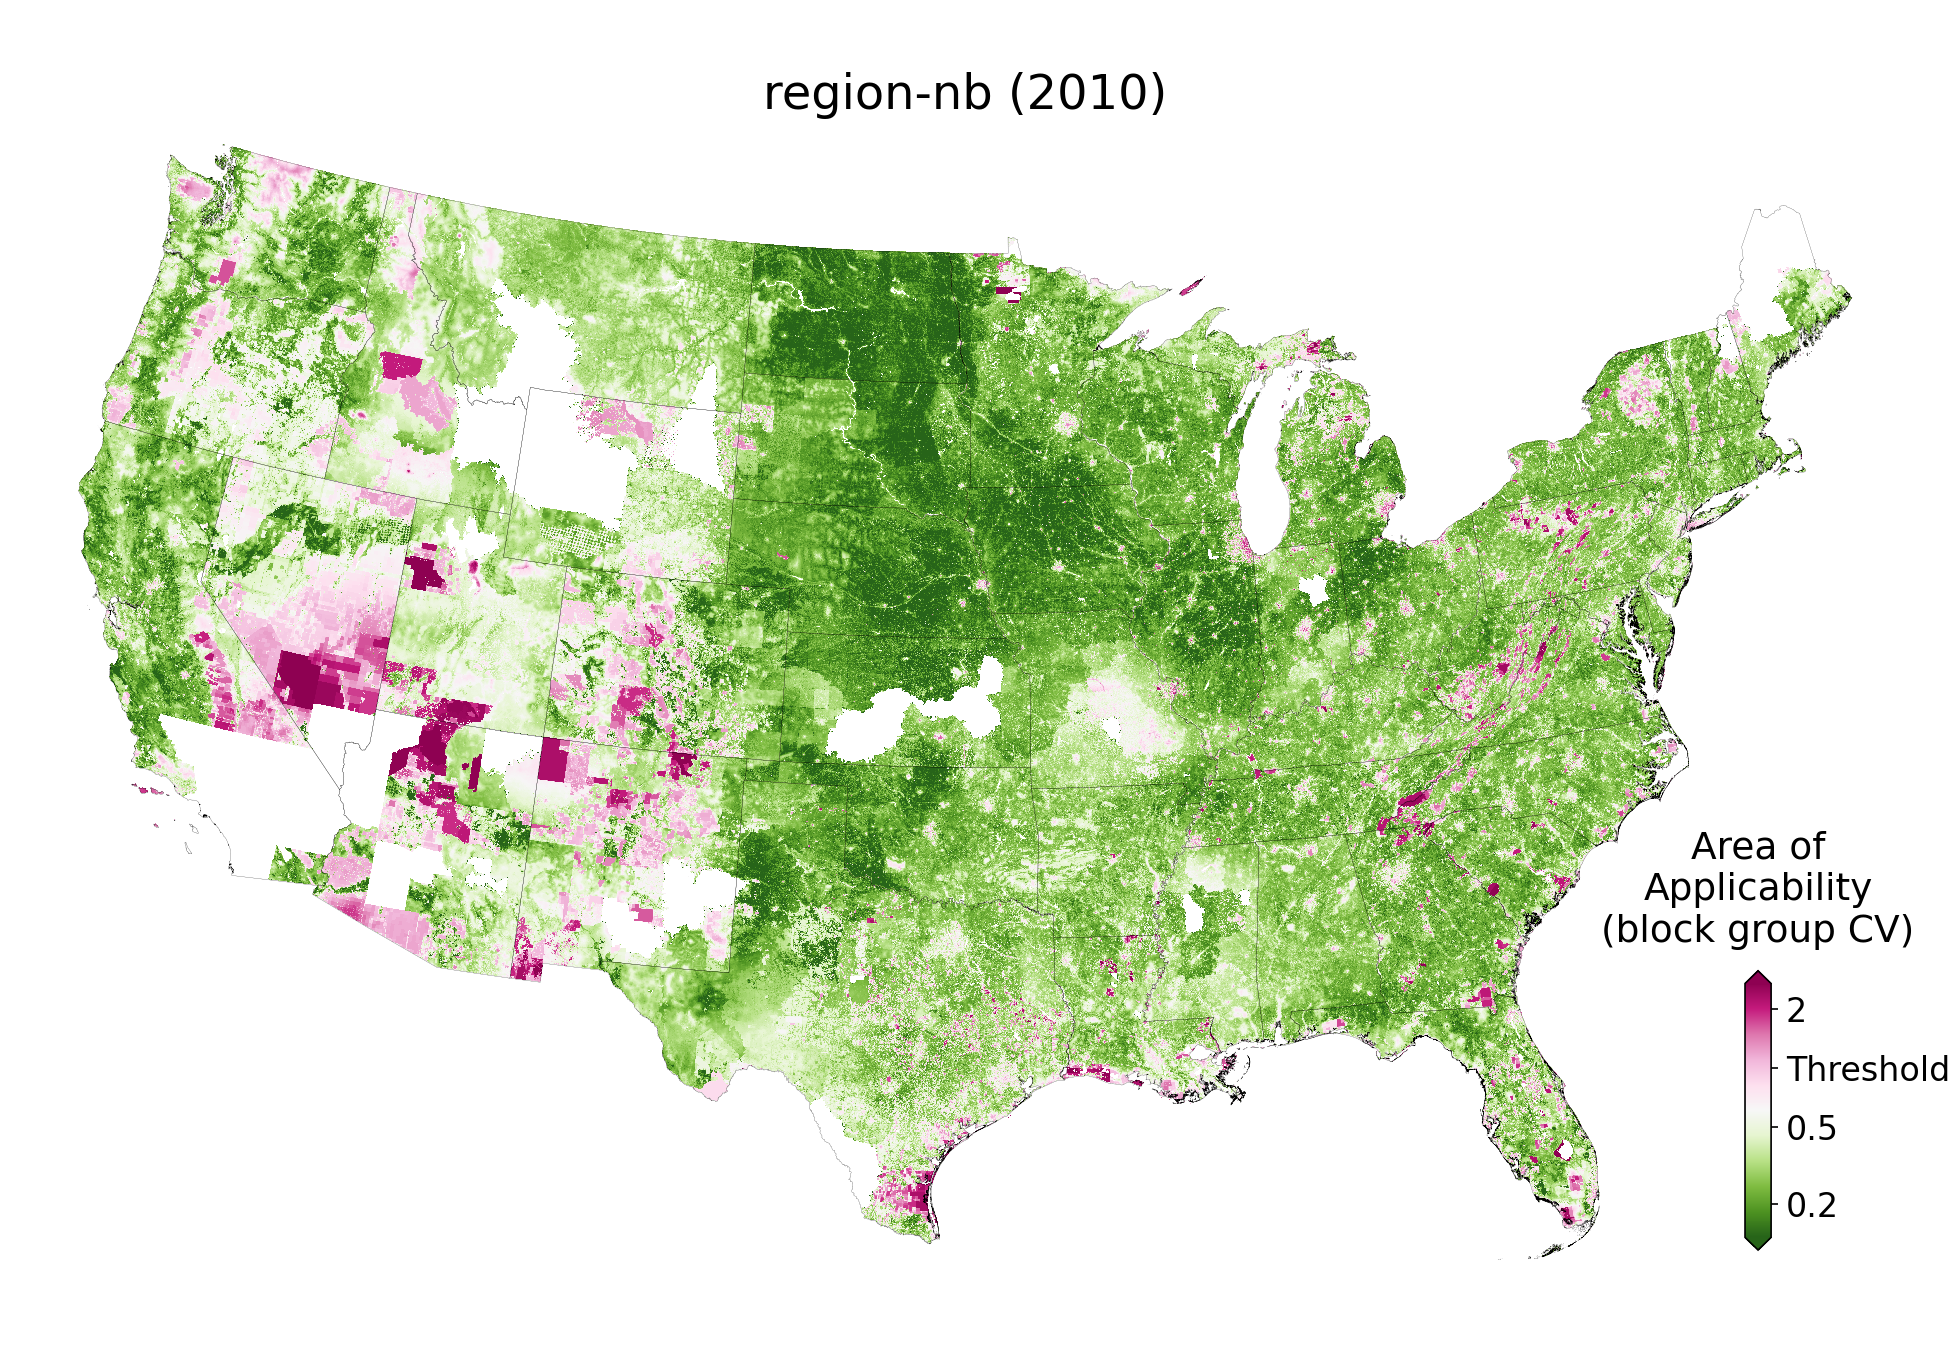
Parcel-level indicator of the Area of Applicability (AOA) for the FMV estimates, standardized and rasterized.
This is a measure of dissimilarity: how “different” is each predicted parcel sale from the sales in the sample that the predicting model was trained on?
It can help identify parts of the landscape for which predictions are extrapolated far beyond the characteristics of the original sample. If such extrapolation occurs, prediction errors and biases can (and often will) be larger than we were able to estimate from the training sample.
Such extrapolation can happen for a number of reasons: some parcels have a particularly unique set of characteristics, others are of a certain type that rarely sells (such as large government-owned lands), others might be located in parts of the landscape with few sales data observations (e.g. non-disclosure states).
Computationally, it is the Euclidean distance in weighted predictor space, where predictors are weighted by their importance in the model (see Meyer & Pebesma 2021).
- Example:
aoa_region-nb_2010_bg.tifis a raster of the area of applicability.For the model
region-nbFor predictions made in the year
2010For which the AOA threshold was determined via cross-validation blocked by census block groups (
bg).
- File location:
rasters/support/aoa_<model_id>_<year>_<cross-validation_type>.tif:model_ididentifies the model.yearis the year for which the prediction was made.cross-validation_typeidentifies the type of cross-validation used to find the AOA threshold.
- Unit:
Unitless distance, rescaled and converted to
uint8(0-255).Values ≤100 are within the threshold of the AOA, values ≥100 are outside.
Our conversion preserves much of the data heterogeneity within a
uint8variable scope (which saves space).\[ln(\frac{dissimilarity\;index}{AOA\;threshold}) - 4) * 25\]where:
dissimilarity indexis the dissimilarity index proposed by Meyer & Pebesma 2021.AOA thresholdis the proposed threshold on the dissimilarity index to identify the “Area of Applicability”.
- Format:
GeoTIFF
- Projection:
Conus Albers (EPSG:5070)
- Resolution:
480 x 480 meters (snapped to the National Land Cover Database)